A University Project
3D Mountain Simulation: Predicting Flood Paths
2024
Ingredients
- Python
- NumPy
- SciPy
- Matplotlib
Subjects
- 3D Reconstruction
- Simulation
- Scientific Computing
Problem
Predicting where water flows and accumulates on mountainous terrain is essential for flood-risk assessment. My bachelor's thesis in Computer Engineering at Shiraz University (Summer 2024, graded 20/20) builds a full pipeline in Python that goes from scattered elevation points to a visual prediction of flood paths and accumulated water volume.
Method
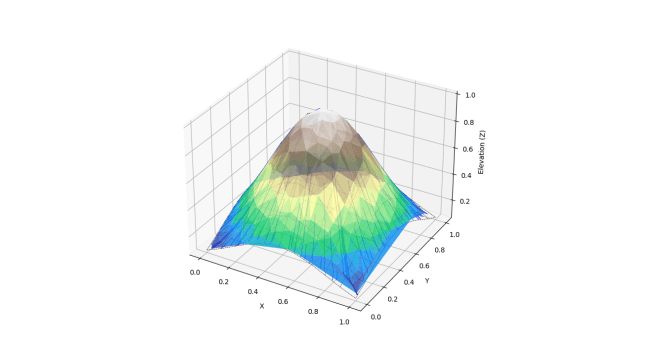
- Terrain — 400 seeded points in the unit square are lifted to 3D with one of eight terrain functions (Gaussian peak, cone, ridges, crater, plateau, mountain with valley, Perlin noise…).
- Delaunay triangulation turns the points into a triangle mesh.
- Per-triangle gradient — a plane is least-squares fitted through each triangle's vertices; its negative slope is the downhill direction.
- Flood-path tracing — from the centre of every cell of a 10×10 grid, a drop follows the downhill vector of the triangle it is in until it leaves the mesh, lands on a flat triangle, or runs out of steps.
- Water accumulation — each cell's rain is added to the cell where its path ends, drawn as a heatmap in the same frame as the 3D plot.
Results
On the default valley terrain the paths run down the central peak and the water collects in the low corner the valley drains into (280 of 1,000 litres end in a single cell), while the peak and its slopes stay dry. An optional Plotly export gives a fully rendered 3D view that rotates smoothly in the browser.
Real elevation data. An experimental script crops a window from an SRTM GeoTIFF tile and runs the unchanged pipeline on it; the default window is the Derak mountain north-west of Shiraz.